


Opinion: Pallavi Choudhuri Sonalde Desai and Santanu Pramanik
Economic insecurity caused by lockdowns during the early days of Covid-19 forced many households to rely on government welfare schemes to fulfil their consumption needs. Using data from the June 2020 round of the Delhi NCR Coronavirus Telephone Survey this article shows that few households received both foodgrains and cash transfers particularly in urban areas and urban residents were also eight percentage points less likely to receive cash transfers vis-à-vis their rural counterparts.
As India plunged into a nationwide lockdown on 25 March 2020 in response to rising rates of Covid-19 infection fears of a humanitarian crisis took over with households struggling to cope on account of the resulting livelihood shock. Results from a rapid access telephone survey by the National Council of Applied Economic Research (NCAER) with a recall period over April and May 2020 documented the tremendous precarity faced by households particularly those linked to informal employment and with little recourse to alternate sources of income or social safety nets.
The prevalence of the pandemic differed across urban and rural areas as did movement restrictions and hence place of residence and occupation moderated the impact of the lockdown on households. Farmers found it easier to engage in their trade since their work was typically limited to their localities. Consequently while 36% of farmers experienced a severe income shock 54% of unorganised sector1 salaried workers 71% of casual wage workers 69% of self-employed and 71% of businesses experienced a severe income shock. Further urban casual wage workers were more likely to face an income shock than their rural counterparts by nine percentage points.
Portending an impending crisis the central government extended the provision of cash and in-kind benefits aimed to provide immediate relief. These were: i) additional free food-grains under the public distribution system (PDS) and ii) transfer of cash to the beneficiaries’ bank accounts linked to a series of pre-existing welfare schemes. In our study (Choudhuri et al. 2022) we use data from the Delhi NCR Coronavirus Telephone Survey (DCVTS Round 3)2 a rapid telephone survey interviewing 3466 households held between 15 and 23 June 2020 to examine the effectiveness of the social welfare outreach across different occupational groups and how these differed across rural and urban regions. In particular we look at how informal workers who tend to lack access to social security benefits and are usually unable to tap into a regular stream of income coped during this period.
Disparities in welfare support in rural and urban areas
We find that since access to safety nets depended on pre-existing registries some of the households most affected by the lockdown were excluded. Further rural-urban differences in the experience of economic distress are not reflected in the access to social safety nets. Some households received foodgrains others received cash transfers but very few benefitted from both particularly in urban areas (see Figure 1). We also find that the predicted probability of urban residents receiving cash transfers was eight percentage points lower than their rural counterparts.
Figure 1. Rural-urban divide in the receipt of welfare support
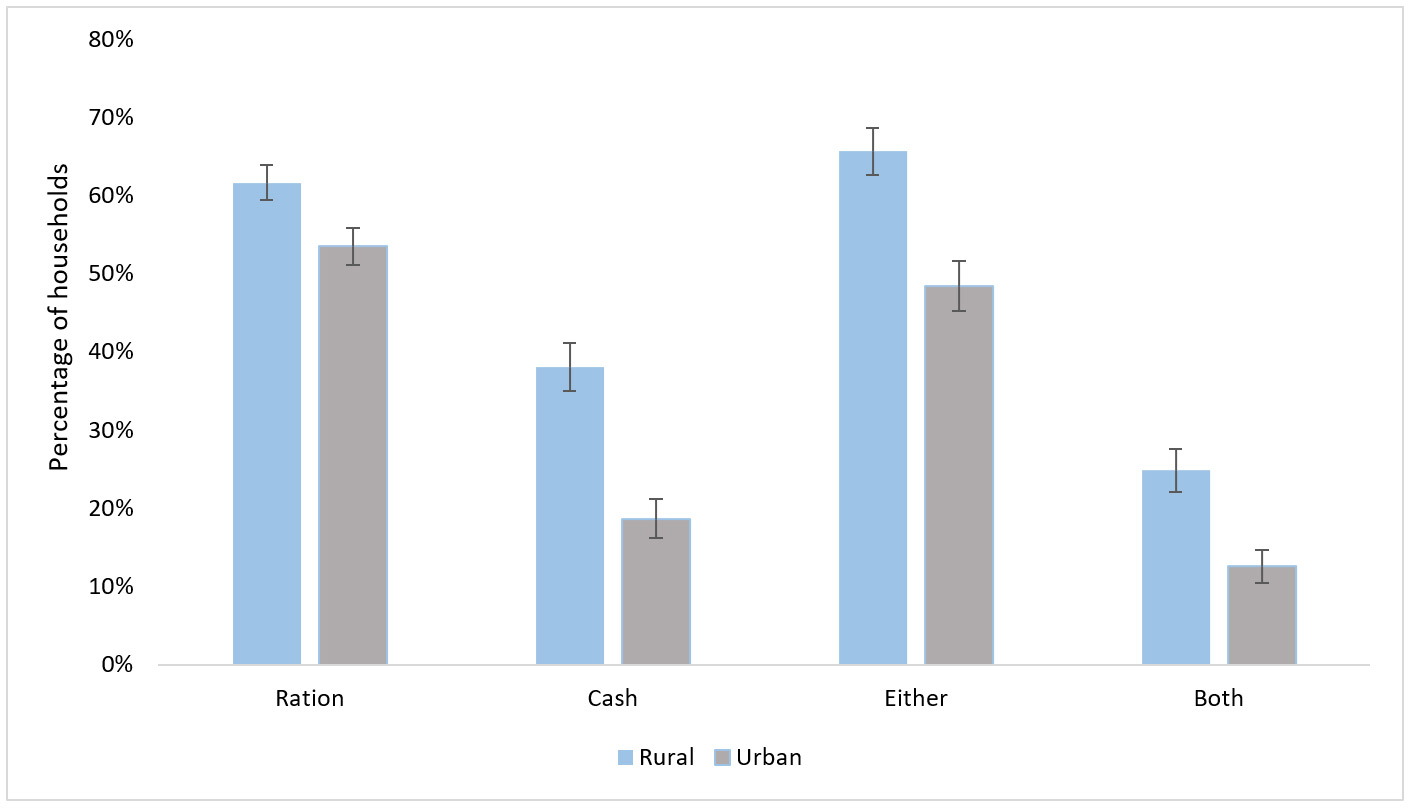
Note: The black standard error bars represent the 95% confidence intervals. A 95% confidence interval means that if you were to repeat the experiment over and over with new samples 95% of the time the calculated confidence interval would contain the true effect.
Food support
Our findings suggest that 23.7% of households reporting casual wage work 18% of those reporting salaried work and 15.7% of those with small businesses suffered from the occasional unavailability of food. Not surprisingly 67% and 50% of the households with casual wage and informal salaried workers respectively reported that they had to borrow in order to manage their daily expenses and consumption. Nonetheless this proportion would likely have been considerably higher without the food distribution undertaken through the PDS system.
Overall we see that 57.7% of the households received food support 15.23% had no need and hence did not avail of food support and 27% suffered from an unmet need for foodgrains between April and May 2020. Data from DCVTS-3 indicate that the non-receipt of foodgrains is associated with lack of documentation – 59.8% of the households with an unmet need did not have ration cards.
To predict the probability of households receiving free additional foodgrains and that of unmet need for foodgrains we estimate a multinomial logistic regression3 with households who voluntarily chose not to receive PDS because they did not need it as the reference category (that is a category for comparison to other categories).4 Overall the foodgrain distribution programme was largely successful in addressing the needs of those most affected by the pandemic – casual wage workers unorganised sector salaried workers and households reporting self-employment.
However we also find that there was unmet need for foodgrains. As seen in Figure 2 the predicted probability for unmet need is 23% for casual wage workers 25.7% for unorganised sector salaried workers and 28% for the self-employed. Further the probability of unmet need increases amongst urban households – the predicted probability is higher by 11 percentage points for households reporting casual wage workers 14 percentage points for self-employment and 18 percentage points for small businesses (household enterprises) that hire workers indicating a greater possibility of being excluded in urban areas.
Figure 2. Rural-urban disparities in the change in predicted probability of unmet need for food ration
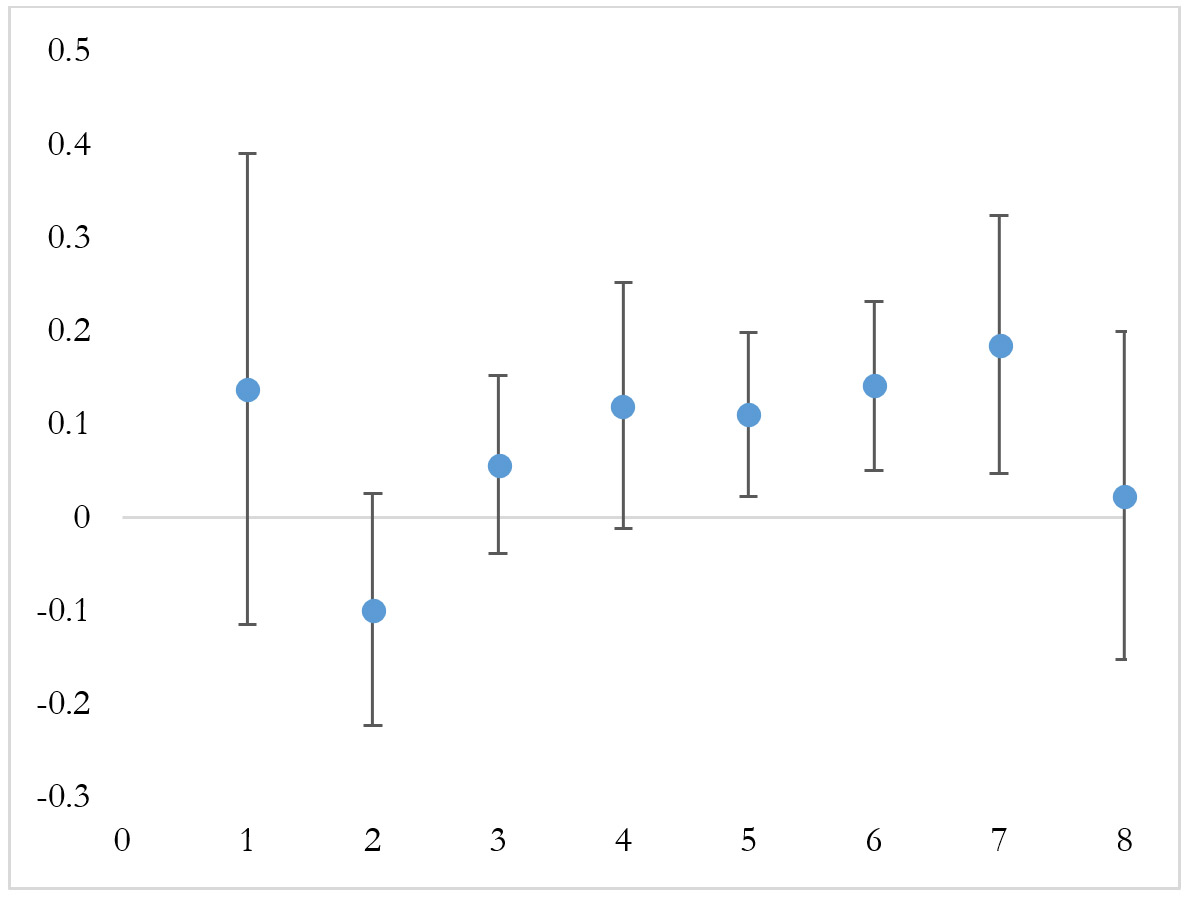
Notes: i) The occupational groups from left to right are cultivator government/public sector undertaking salaried (greater than or equal to 10 workers) salaried (less than 10 workers) casual wage business (which rarely/doesn’t hire) business (hires) and rent/remittances. ii) Figure shows change in probability from rural (0) to urban (1). iii) Standard errors have been calculated using the delta method. iv) Estimates use the 95% confidence intervals.
Cash support
We estimate the amount of cash received conditional on those who received the cash support5. The use of prior registries resulted in cash reaching beneficiary bank accounts in record time but the results also point towards a significant urban disadvantage.
The first stage regression results show that households reporting salaried work in the organised sector or as salaried workers in the unorganised sector or reporting businesses that hire workers are less likely to receive cash support compared to cultivators. The probability goes down by 10.6 21.2 and 28.3 percentage points respectively if such households are located in urban areas (see Figure 3 left panel). Conditional on receipt an urban household reporting informal salaried work is likely to receive an average predicted value of cash support of Rs. 696.5 per month (see Figure 3 right panel) or Rs. 23 per day for a representative family of five members – well below the official poverty line of Rs. 49 per day per person in an urban area6.
Figure 3. Rural-urban disparities in predicted probabilities (left panel) and value (right panel) of cash support
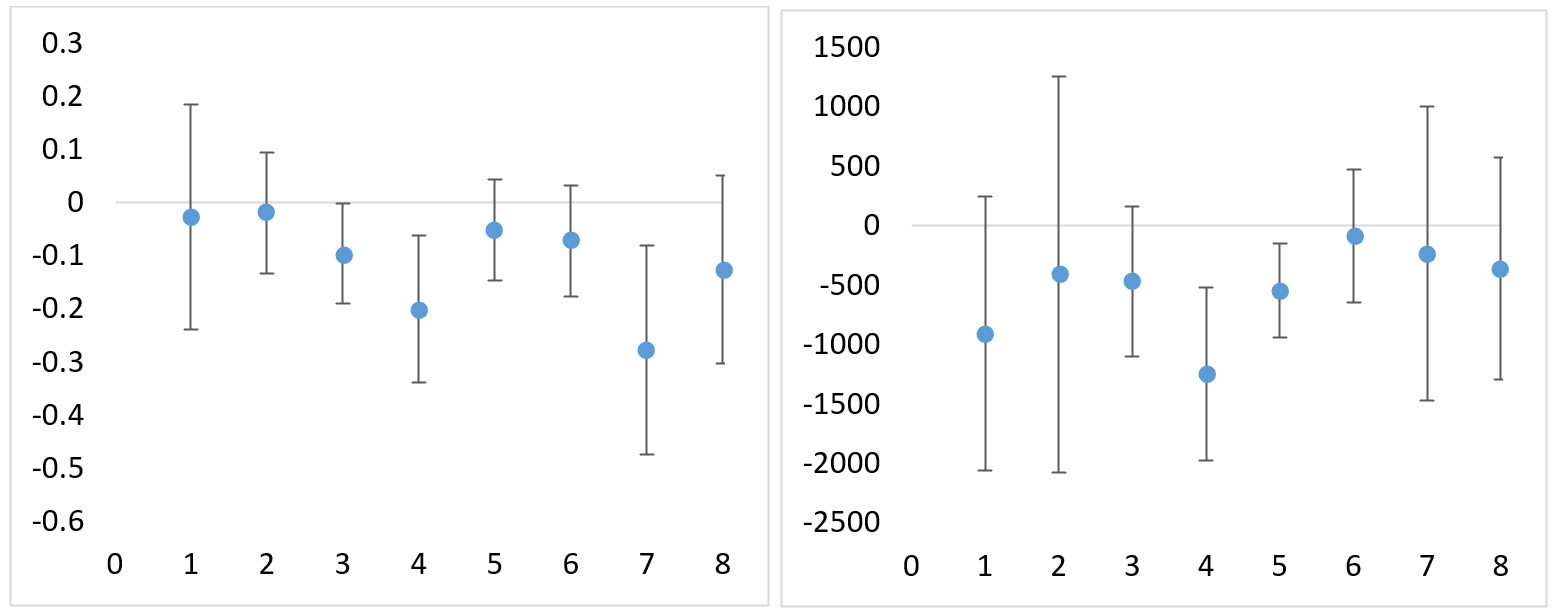
Notes: i) The occupational groups from left to right are cultivator government/public sector undertaking salaried (greater than or equal to 10 workers) salaried (less than 10 workers) casual wage business (which rarely/doesn’t hire) business (hires) and rent/remittances. ii) Figure shows change in probability from rural (0) to urban (1). iii) Standard errors have been calculated using the delta method. Estimates use the 95% confidence intervals. iv) The right panel provides estimates for predicted value of cash support conditional on receipt of such support.
Scheme-level support
A scheme-level breakdown of some of the key programmes sheds more light on the gaps in targetting. The government announced a transfer of Rs. 500 in three equal monthly payments to women account holders of the Pradhan Mantri Jan Dhan Yojana (PMJDY)7 account. Our findings suggest that 23.3% of all the sample households received such transfers with such transfers prevalent across both below poverty line (BPL) and non-BPL households. This is also consistent with findings from other studies (Pande et al. 2020 Somanchi 2020).
In terms of PM Kisan8 of the 18% farmer households in the DCVTS-3 sample only 21% received such transfers – 42% of these households belonged to the wealthiest assets tertile9 of the sample and another 28.5% belonged to the middle tertile. Further the PM Kisan scheme applies to landowners and therefore excludes agricultural workers or tenant farmers. However not all landed farmers received the benefits.
Conclusion
The prevalence of exclusion even though moderate necessitates discussions on targetting and selectivity. Targetting of the poor is often based on complex selection criteria which tends to be riddled with exclusion errors (Jhabvala and Standing 2010). These errors get amplified when economic insecurity is more widespread triggered by a large-scale shock. While social registries can ensure that cash is transferred expeditiously registries based on specific deprivations may not identify individuals who are most vulnerable in the event of a crisis.
Using data from the Indian Human Development Survey (IHDS) a study by Thorat et al. (2017) finds evidence that factors that allow families to move out of poverty may differ from the ones that push people into it. This poses a challenge for policymakers in targetting welfare beneficiaries in response to shocks and calls for the adoption of a more universal approach to designing relief packages for alleviating distress resulting from such dramatic shocks.
When external events affect all residents of an area focussing on geographical areas that are most affected by the crisis may be more effective than targetting individuals with specific characteristics. Considering that the immediate effect of the pandemic was more acutely felt in urban areas the targetting framework needs to take into consideration such geographical segregation and the need for putting in place a more robust institutional framework of local governance that can help create social registries in urban areas.
Notes: