Press Release: NCAER releases its N-SIPI 2018, the NCAER-STATE INVESTMENT POTENTIAL INDEX
03 Aug 2018
“Delhi leads the NCAER-State Investment Potential Index 2018 Tamil Nadu is second.”
New Delhi (Friday August 3 2018): The National Council of Applied Economic Research NCAER released its 2018 N-SIPI the NCAER State Investment Potential Index at a launch workshop inaugurated by Shri Ramesh Abhishek Secretary Department of Industrial Policy and Promotion (DIPP). Covering 20 States and Delhi this is the third edition of the annual N-SIPI that ranks India’s States’ on their competitiveness in business and their investment climate. Compared to 2017 Delhi jumps one spot to lead N-SIPI 2018 Gujarat ranks at the third position and Maharashtra Tamil Nadu move into the top five at second and fifth position and Haryana retains its fourth place ranking. Since its launch the annual N-SIPI has become a credible yardstick of how the investment climate of India’s States is changing.
NCAER launched the N-SIPI series in March 2016 and the second N-SIPI 2017 was released in July 2017. N-SIPI is a pioneering effort to provide metrics of economic governance competitiveness and growth opportunities at the state and regional levels. The Index is designed to provide a systematic and reliable “go-to” reference for policy makers existing businesses and potential domestic and overseas investors.
While delivering the keynote remarks at the launch of N-SIPI 2018 Mr Ramesh Abhishek Secretary Department of Industrial Policy and Promotion complimented NCAER for its perceptive and insightful study on the investment potential of India’s States. He said “Studies like the NCAER State Investment Potential Index are critical to increasing competitiveness in the business climate of States. What makes NCAER’s work unique is the aspect of reaching out to stakeholders and working on the perception-related parameters.”
He explained that studies like NCAER Index immensely aid State Governments by bringing issues related to business and investment climate to the forth forcing governments to make it a priority. The studies also support the bureaucracy in policymaking pooling resources and re-engineering procedures. He went on to say that government is taking the effort further by working on related aspects of capacity building sharing good practices encouraging States to help and mentor each other and recognising good work. He remarked “From the pioneering initial N-SIPI 2016 report NCAER’s work has been very comprehensive bringing out aspects that are very relevant to investors giving them a good understanding on where to invest. N-SIPI looks at secondary data that represent state-level outcomes that investors look at and also looks at their perceptions of the business climate along with some of the variables that the overall index looks at. This nicely complements an effective process focussed effort that DIPP has been pursuing in its Business Reforms Action Plan. We look forward to working with NCAER to make the entire exercise of assessment of States in their ease of doing business better.”
Dr Shekhar Shah Director-General NCAER remarked that “India is the fastest growing economy of the world and remains a highly desirable investment destination. The 2018 A. T. Kearney Foreign Direct Investment Confidence Index ranks India 11th in the world above Singapore Netherlands and Sweden: it is the only lower middle-income country in the top 25 countries ranked by the Index. With India being the world’s third largest market the prospects for growth and investment are truly outstanding.”
He further said that “Investment opportunities are expanding in India in all sectors. The introduction of GST has bound India’s States together in ways that has not been possible before. Taking cognizance of this need N-SIPI 2018 has expanded its survey questionnaire for its perception pillar by including GST-specific questions. N-SIPI 2018 NCAER’s third edition in the annual series of states’ rankings is an evidence-based index that will help build continuity consistency and rigour in ranking investment targets for investors. As importantly it will help State policymakers measure their State’s performance against that of others. N-SIPI does not track how States have done over time since almost all States have improved but it measures the relative ranking of States every year.”
Dr Shah ended by noting that “We look forward to working closely with interested individual State leaderships to probe deeper into their N-SIPI Index and to explore ways of improving their investment climate in focussed and effective ways.”
What does the 2018 N-SIPI do?
Building on the success of N-SIPI 2016 and 2017 N-SIPI 2018 ranks the competitiveness of Indian States on six pillars: land labour infrastructure economic climate political stability and governance and business perceptions. These six pillars are classified under four broad categories: factor driven (land and labour) efficiency driven (infrastructure) growth driven (economic climate and political stability and governance) and perceptions driven (ranking of business climate built on firm surveys). A unique feature of the N-SIPI index is the integration of industry perceptions of the investment potential and business climate of a state along with the fundamentals likely to drive investment decisions in that state. Another unique feature of the 2018 N-SIPI is the inclusion of GST specific questions in the survey questionnaire for the perception pillar of the index.
Against the backdrop of the implementation of India’s long-awaited goods and services tax which aims to create an integrated common market and promote competitive and cooperative federalism the focus of many policy reforms is shifting to the States. Given the growing state-level investment opportunities N-SIPI 2018 is hence uniquely positioned to enable decision makers to assess the business potential offered by each state and develop each state in accordance with its strengths and limitations. N-SIPI 2018 nicely complements the World Bank’s Ease of Doing Business (EOD) surveys and DIPP’s assessment of progress made by States on business reforms. It is much broader and more representative than the EOD ratings and at the same time more concise and focused than the DIPP progress assessment.
While introducing N-SIPI 2018 the project leader of the study and Senior Fellow at NCAER Dr Anushree Sinha remarked “N-SIPI 2018 is unique as it measures investment potential with five secondary data based pillars along with a survey pillar based on a panel data that includes responses on GST and e-Way bill. She further said “DIPP’s index is based on their action plan whereas the NCAER index is anchored on perception of the firms in the States. To some extent the perceptions are also influenced by awareness and the onus of spreading awareness is with the Centre and State Governments in that order. NCAER feels that perception is a forerunner of the actual intent of investment. The level of awareness of the ground level state official is also a critical driver of perception. At the same time the State officials may lack initiative for various reasons like work load benefits etc. There is a need for spreading awareness and for a stronger regulatory framework apart from better implementation of reforms across the States.”
Key 2018 N-SIPI Findings
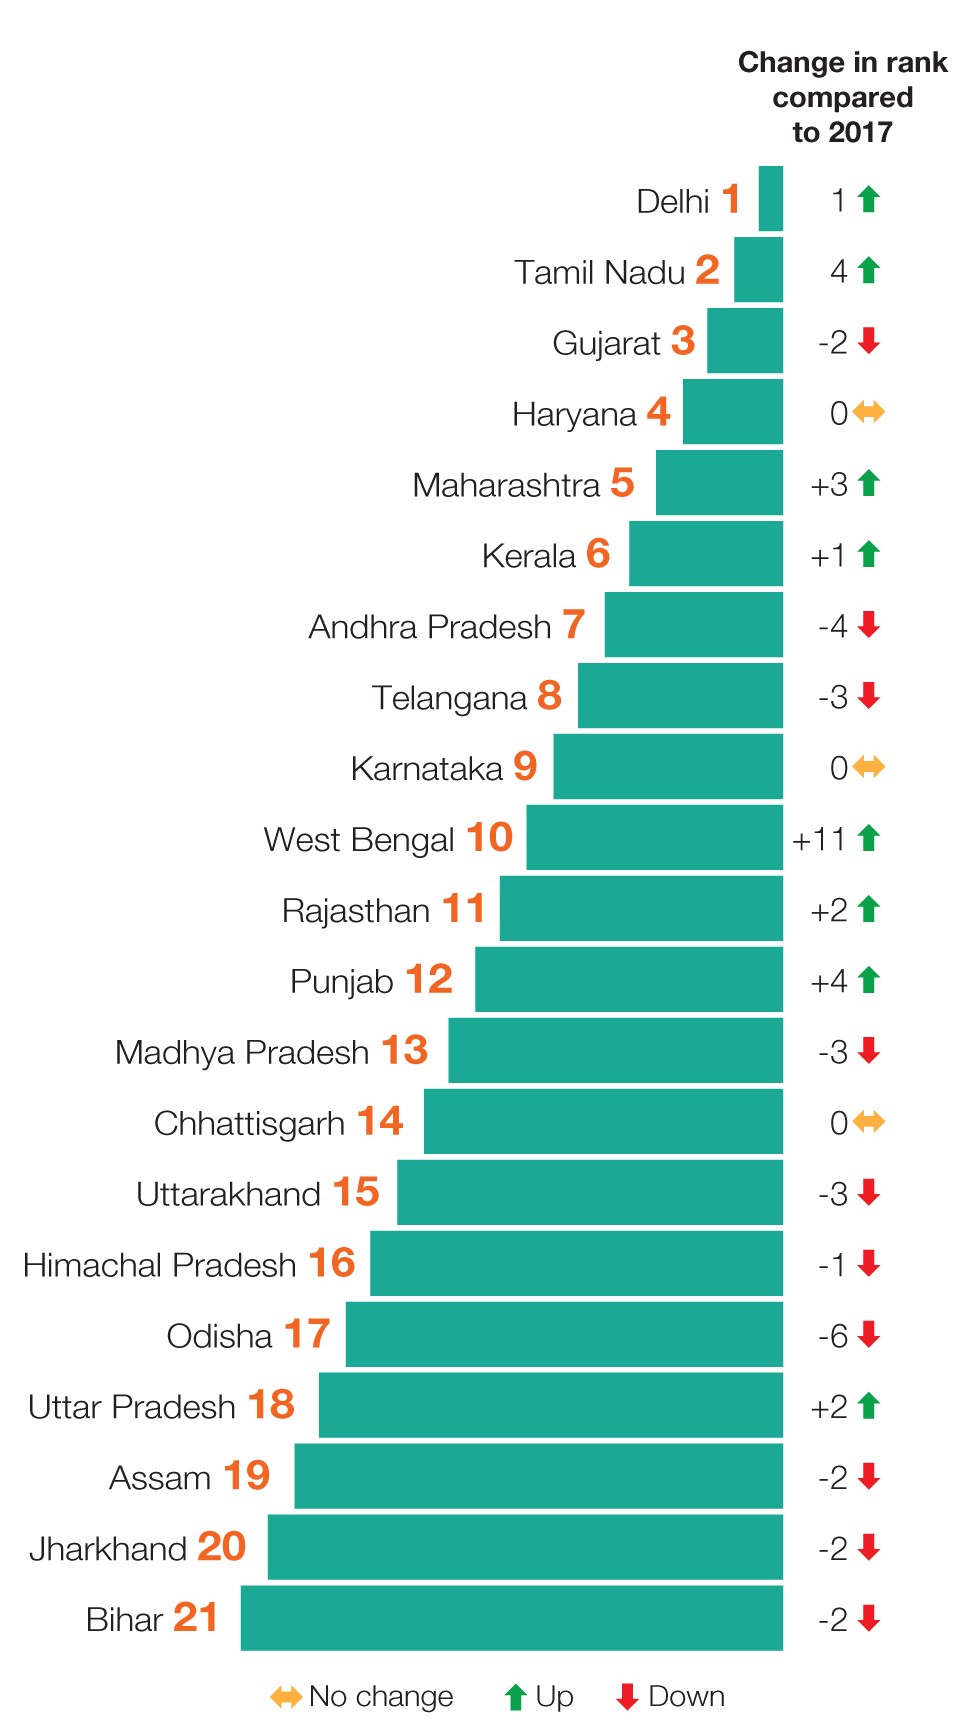
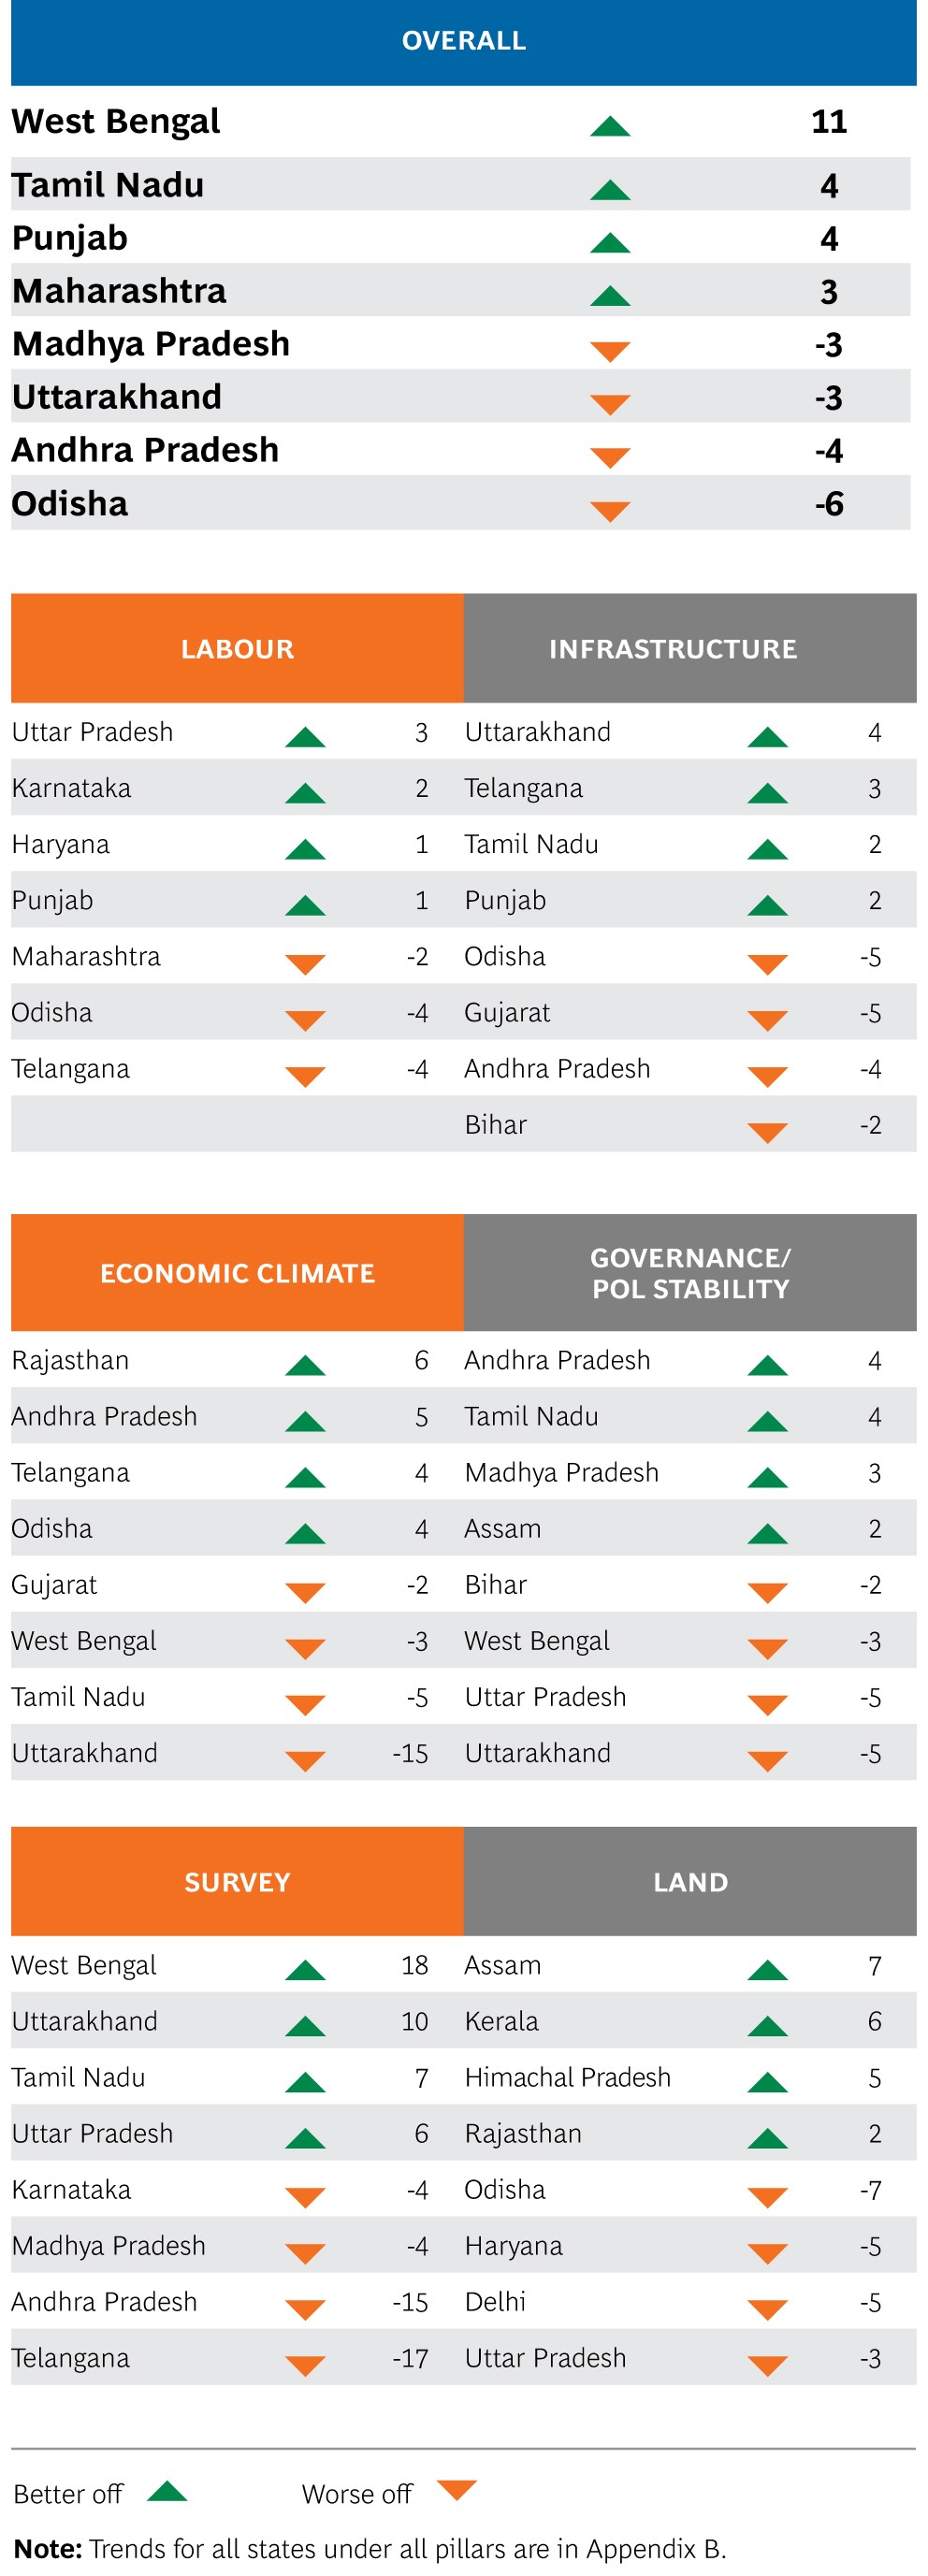
The key findings of the 2018 N-SIPI show that Delhi Tamil Nadu Gujarat Haryana Maharashtra and Kerala are the top six States for business investment potential. At a greater level of detail Delhi tops the rankings under the third and fourth pillars on infrastructure and economic conditions in the state. Tamil Nadu comes in second place and tops the rankings in labour and governance. Compared to the 2017 ranking West Bengal Tamil Nadu and Punjab have made the most rapid gains in 2018 moving up by 11 4 and 4 spots to the 10th 2nd and 12th positions respectively. The 2018 N-SIPI ranking of States and the relative shifts compared to 2017 are in Figure 1 and Table 1 below.
Although Assam Jharkhand and Bihar are ranked among the least favourable States for investment they are ranked higher under individual pillars with Bihar doing better in the labour pillar Assam in the land pillar and Jharkhand in the economy pillar. Chhattisgarh and Karnataka maintain their ranks from last year at the 14th and 9th positions respectively. Assam Kerala and Himachal Pradesh made the most rapid gains in becoming more competitive under the land pillar while Haryana Odisha and Delhi slid down the rankings. In the labour pillar Uttar Pradesh and Karnataka moved closer to the top while Odisha and Telangana moved further away. Uttarakhand and Telangana achieved the most gains in the infrastructure pillar while Gujarat and Odisha witnessed the maximum slippage. As regards the economy and governance pillars Rajasthan and Tamil Nadu respectively gained the most while Uttarakhand and Uttar Pradesh respectively were the largest losers. Under the survey pillar Uttarakhand and West Bengal saw a massive improvement in industry perceptions with regard to the investment potential but Andhra Pradesh and Telangana suffered big losses in terms of the perceptions of industrial firms.
Corruption continues to be the number one constraint faced by businesses as found in the N-SIPI 2017 survey. But perceptions of corruption may be changing: the 2017 N-SIPI reports a decline in the percentage of respondents citing corruption as a constraint to conducting business from 57 percent in 2017 to 46 percent in 2018. Getting approvals for starting a business was the second most pressing constraint faced by businesses both in 2016 and 2017 though this figure has declined from 72.1 per cent to 43.6 per cent over the years.
The 2018 N-SIPI perception survey shows that the difficulty in obtaining approvals for land the quality of skilled labour and access to finance. These issues are also the focus areas of the present government under the National Skill Development Mission launched in July 2015 and the Jan Dhan Yojana in August 2014. The transition of the tax policy to GST has been ranked by 44.5 per cent as a major constraint and more than half of the surveyed industries reported no problem related to tax policy transition to GST. Interestingly industry-related policies and the availability of unskilled labour are not that problematic while the availability of power and raw material and rail and road quality and connectivity are seen to be the least problematic for the firms in the sample.
NCAER will update this evidence-based index annually. Along with DIPP’s assessment of business reforms and the World Bank’s index on the Ease Of Doing business N-SIPI should aid governments in policy making as well as allow both Indian and foreign investors to make informed investment decisions.
Figure 1: The 2018 NCAER-State Investment Potential Index Overall Rankings

Table 2: The 2018 NCAER State Investment Potential Index (2018 N-SIPI)
Changes in State Rankings in 2018 as compared to 2017 Overall and Individual Pillars


