


The National Council of Applied Economic Research (NCAER), one of India’s premier economic policy research think tanks, carried out the 124th Round of its Business Expectations Survey (BES) in March 2023, with support from the National Stock Exchange of India Limited (NSE). NCAER has been carrying out the BES every quarter since 1992, covering 500 firms across four regions.
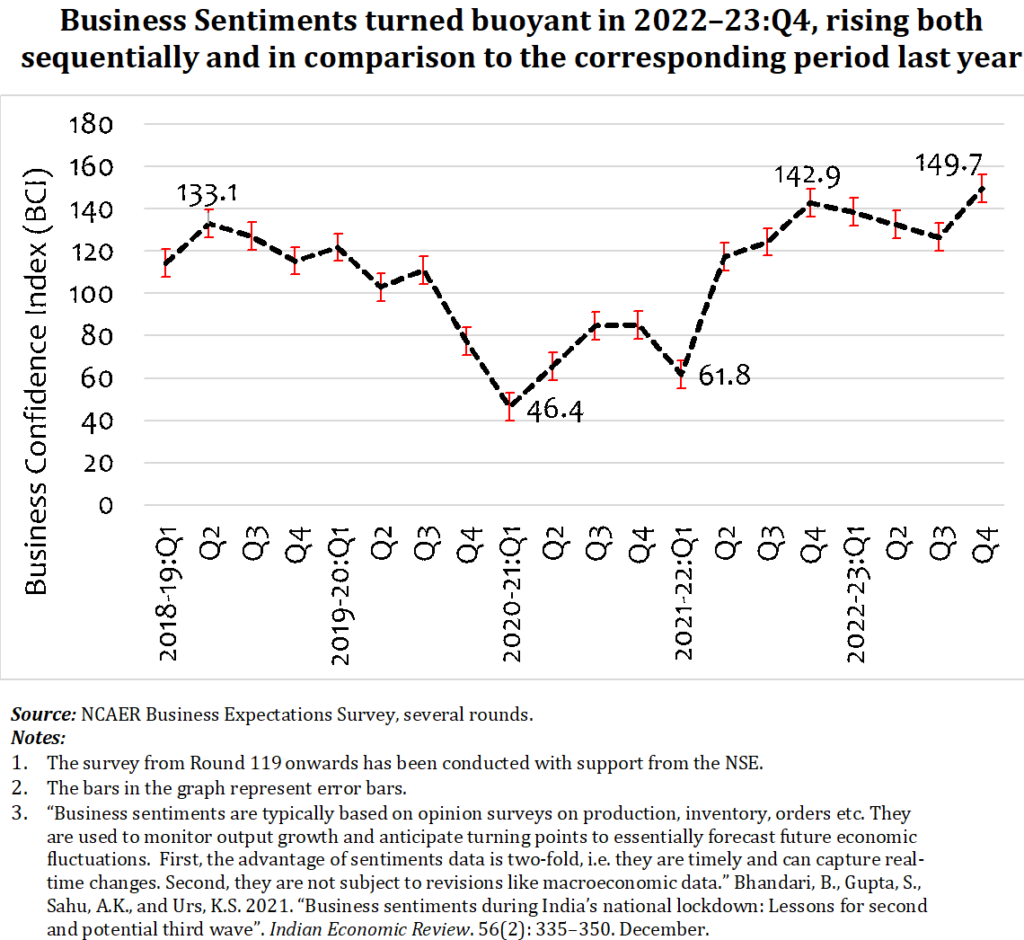
After moderating for three consecutive quarters in 2022–23 on a sequential basis, business sentiments turned buoyant in March 2023, though there is a mixed trend in sentiments about business prospects for the next six months. While sentiments about production, domestic sales, pre-tax profits and new orders improved in 2022–23:Q4 versus 2022–23:Q3, expectations about exports, imports of raw materials, and ex-factory prices remained muted.
In 2022–23:Q4, the BCI rose to 149.7. It was higher than the previous quarter at 126.6 in 2022–23:Q3 and the corresponding quarter in the previous year at 142.9 in 2021–22:Q4.
The BCI is driven by four components, with each of them being assigned equal weights in the Index – ‘overall economic conditions will be better in the next six months’, ‘financial position of the firms will improve in the next six months’, ‘present investment climate is positive’ and ‘present capacity utilisation is close to or above optimal level’. The share of positive responses was higher for all four components of the BCI in 2022–23:Q4 compared to 2022–23:Q3.
The latest BES Report can be accessed and downloaded from here.
Methodology: NCAER has been conducting the BES every quarter since 1991. The BES findings reported here relate to 500 firms. The survey elicits responses from firms across six cities to assess business sentiments in the four regions of India: Delhi-NCR, representing the North; Mumbai and Pune, the West; Kolkata, the East; and Bengaluru and Chennai, the South. All the industries are represented in terms of ownership type (including public sector, private limited, and public limited firms, partnerships/individually owned firms, and multinational corporations); the industry sector (including consumer durables, consumer non-durables, intermediate goods, capital goods, and services); and firm size based on the annual turnovers of the firms (in the range of less than or equal to ₹1 crore, more than ₹1 crore to less than or equal to 10 crore, more than ₹10 crore to less than or equal to ₹100 crore, more than ₹100 crore to less than or equal to 500 crore, and more than ₹500 crore). The sample is drawn randomly from a list of firms in each city. A sizeable number of units taken in one round are retained in the next round to maintain continuity of the analysis.
The BCI is computed on the basis of responses from firms to four questions. Two of these questions focus on macro factors and the other two on micro factors. All the questions carry equal weight. The BCI is a simple average of all the positive responses in the case of three questions, whereas in the case of the fourth question on capacity utilisation, an average of the sum of the responses indicating ‘improvement’ and ‘status quo’ is taken. Thereafter, the BCI is compared with the base value (denoted by the value of 100 in Round 7; 1993) to determine any change. An increase in the level of the BCI (signified by a larger share of positive responses) reflects optimism in the business sector about the performance of the economy.